Nutrient richness
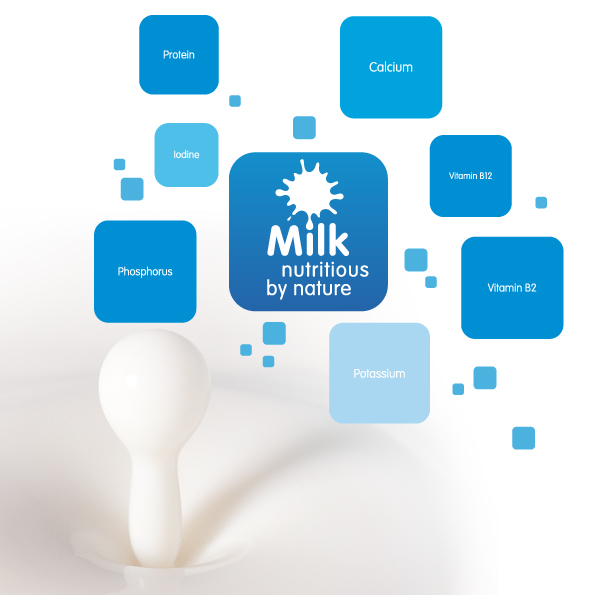
A unique package of essential nutrients
Milk and dairy foods are naturally rich sources of a wide range of essential nutrients. Many people associate milk and dairy with calcium and bone building but dairy foods offer much more extensive nutritional benefits.
Milk contains high quality protein, carbohydrate in the form of lactose, as well as different fatty acids and a wide range of micronutrients including vitamins, minerals and trace elements.
Milk is a natural source of calcium, vitamin B12, riboflavin (vitamin B2), phosphorus and potassium. It also contains smaller amounts of other nutrients including vitamin A, niacin, folate, vitamin B6, vitamin D, magnesium, selenium and zinc. In some, but not all, European countries milk is also a good source of iodine. The variation in iodine content is mainly due to differences in cows’ diets between countries. The cows’ diet can also affect the content of other nutrients, for example fatty acids and selenium.
Products made from milk such as yogurt, fermented milks and cheese also contain many of the nutrients which are present in milk. Many yogurts and cheeses, for example, are natural sources of protein, calcium, phosphorus and vitamins B2 and B12. Hard cheeses, in addition, also have zinc and vitamin A.
Nutrient functions
The nutrients present in milk and dairy foods are involved in a number of important functions in the body1. These include the well-known benefits of calcium for bones and teeth, and protein for muscle. But dairy nutrients also play a part in nerve and muscle function, energy release, vision, blood clotting and red blood cell formation, digestion, blood pressure, skin health, the immune system, psychological function and in children’s growth.
Contributing to diet quality in Europe
Given their rich nutrient content, it is not surprising that milk and dairy foods make an important contribution to the nutritional quality of the European diet. In many countries they are the main providers of calcium, contributing to 40% – 70% of the calcium intake in the European diet. Dairy also makes significant contributions to the intake of many other nutrients including high-quality protein, riboflavin, vitamin B12, phosphorus, vitamin A, iodine, zinc and potassium. For some countries and age groups, milk and dairy products also make worthwhile contributions to intakes of selenium, magnesium, niacin, folate and vitamin D.
Contribution (%) of dairy foods to nutrient intakes in adults in eight European countries:
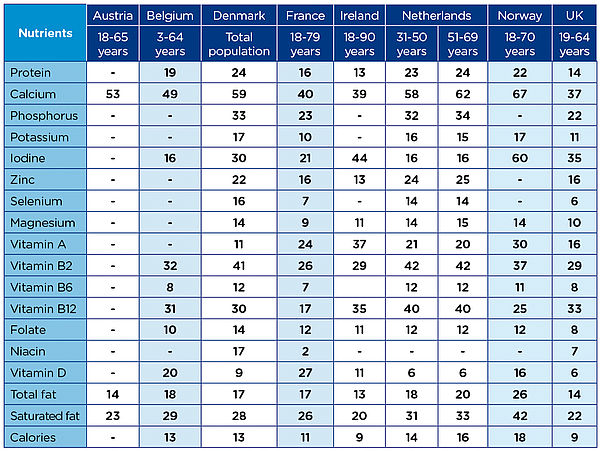
The total amount of dairy foods consumed and the relative contribution of milk and other dairy products differs between countries, and, therefore, affects the contribution to nutrient intakes - for example, cheese makes a more important contribution to nutrient intake in France and Belgium than it does in the UK or Ireland where milk contributes proportionately more. Similarly, both the types and amounts of dairy consumed vary with age and so, therefore, do contributions to nutrient intakes. In general, milk contributes proportionally more to the diets of young children than to adults2,3.
Some of the nutrients provided by dairy are not easily replaced by other foods without reducing the overall nutritional quality of the diet. For example, modelling dietary patterns to remove dairy and replace with non-dairy substitutes for calcium, resulted in lower amounts of several nutrients including protein, phosphorus, riboflavin, zinc and vitamin B124.
Inadequate intakes of certain nutrients in the European diet are partly a consequence of low dairy consumption. A study providing information about micronutrient intakes across Europe shows that in some countries including France, the UK and, to a lesser extent, Denmark, intake of some micronutrients is inadequate, particularly among adolescents and young women5. These include calcium, iron, potassium, iodine, magnesium, selenium, zinc and riboflavin. Low intakes of magnesium, potassium, selenium were also evident in people over 60. With the exception of iron, these nutrients are all found in dairy foods, and the inadequate intakes are likely to be partly a reflection of low dairy intakes. In relation to teenagers and young women, for example, in many countries, milk drinking tends to decline in the teenage years especially in girls, with adverse consequences for intake of ‘dairy’ nutrients, which can be particularly important at this life-stage6.
The wide range of milk and dairy foods can suit different dietary needs. People with low energy requirements or those who are restricting their energy intake in order to lose weight, still need adequate amounts of protein, vitamins and minerals which low-fat dairy foods can provide. Others such as young children and the frail elderly may, in addition to their nutrient requirements, need to pay special attention to ensure their energy needs are met despite small or reduced appetites, and in this case whole milk and whole milk dairy products can be the most appropriate.
Nutrient Density
It is increasingly recognised that a food’s total nutrient content is important, rather than just the particular individual nutrients it contains. For example, in addition to specifying the quantities of nutrients needed in the diet, the latest Nordic Nutrition Recommendations emphasise the need to consider the particular foods that nutrients are obtained from and the quality of the food11.
One approach which takes into account the overall nutritional package of a food is nutrient density. The nutrient density of a food is usually defined as the ratio of essential nutrients, compared with the energy (calories) provided by the food – in some definitions these are also corrected for the presence of nutrients ‘to limit’ such as fat and sodium. The contributions of milk and milk products, particularly low-fat dairy, to nutrient intakes are relatively high compared to their calorie and fat contribution, giving them a favourable nutrient density score12.
Some scoring systems (such as the US Nutrient Rich Foods Index), which rank foods on the basis of their nutrient content per calorie, also allow the calculation of nutrients in relation to the cost of the food13. This is intended to help people choose diets that are both affordable and nutrient dense. Using such scoring systems, dairy foods, especially milk, have been shown to provide good nutritional value in relation to both calories and cost. This has been shown in European studies, as well as in the US14-16.
An important part of European dietary guidelines
The milk and dairy food group forms an important part of food-based dietary guidelines across Europe, and dairy is recognised as one of the components of a healthy dietary pattern.
Food-based dietary guidelines
Dairy forms part of food-based dietary guidelines throughout Europe. The specific recommendations vary between countries, but on average 2 to 3 servings of milk and dairy foods a day are recommended for adults; often more for children and adolescents (around 3 to 4 servings), and in some cases more for pregnant women and older people too.
In some countries, dairy consumption falls short of the recommendations. In Belgium, for example, only 2% of the population (aged 3 to 64 years) meets the recommended intake of milk and milk products (except for cheese)7. In Ireland, adults (18 to 64 years) consume on average just over two portions from the ‘milk, yogurt and cheese’ food group a day compared to the recommended three servings; only 13% of adults meet this target8. In older Irish adults (60 years plus) the figure is lower still, at 3.5%9. Moreover, in many countries, milk and dairy consumption is declining. In France, for example, data from the CCAF Survey (French eating behaviours and consumption) reported a drecrease in milk intake between 2013 and 2016 of 10% in children (3 to 17 years) and 18% in adults10.
Dietary Patterns
Milk and dairy foods are recognised as part of a healthy dietary pattern. Increasingly, research is focusing on the effects of the whole diet on health and trying to distinguish the most favourable dietary patterns and habits. This is beginning to be translated into guidance for the public, including at national level. The 2012 Nordic Nutrition Recommendations, for example, have a stronger emphasis than previously on the whole diet, and describe a healthy dietary pattern as including plenty of vegetables, fruits and berries, pulses, regular intake of fish, vegetable oils, wholegrains, low-fat versions of dairy and meat, and limited intake of red and processed meat, sugar, salt and alcohol11. Similarly, in the 2015 Dutch Dietary Guidelines, the Health Council of the Netherlands sets out what constitutes a healthy dietary pattern for the population, including milk and dairy foods17.
Dairy food consumption data sources
Austria:
Austrian Nutrition Report 2008
Figures refer to adults 18 – 65 years.
Elmadfa I, Freisling H, Nowak V, Hofstädter D et al. Vienna, March 2009
Belgium:
Food Consumption Survey, Belgium 2014-2015
Figures refer to population 3-64 years. Total dairy = cheese, milk, yogurt, milk deserts (e.g. pudding), milk drinks, curd (~ fresh white cheese), soy drinks, soy deserts
De Ridder K, Bel S, Brocatus L, Lebacq T, Moyersoen I, Ost C & Teppers E. De consumptie van voedingsmiddelen en de inname van voedingsstoffen. In: Bel S, Tafforeau J (ed.). Voedselconsumptiepeiling 2014-2015. Rapport 4. WIV-ISP, Brussels, 2016
Denmark:
Dietary habits in Denmark 2011-2013
Figures refer to the total population, rather than adults only.
Main results: DTU Food – National Food Institute. Copenhagen 2015
France:
INCA 3: Third National Nutrition Survey 2014-15
Figures refer to percentage contribution of ‘milk, yogurt, cottage cheese, cheese and milk desserts’ food group for French adults aged 18-79 years.
ANSES (French Agency for Food, Environmental and Occupational Health & Safety)
Detailed results of INCA3 survey: https://www.anses.fr/fr/system/files/NUT2014SA0234Ra.pdf
(report in French, June 2017)
Ireland:
National Adult Nutrition Survey 2008-2010
Figures refer to percentage contribution of all milk, cheese, yogurt, cream and butter for Irish adults aged 18-90 years.
Feeney E et al. An overview of the contribution of dairy and cheese intakes to nutrient intakes in the Irish diet: Results from the National Adult Nutrition Survey. Br J Nutr. 2016; 115: 709-717.
Netherlands:
Dutch National Food Consumption Survey 2007-2010
Diets of children and adults aged 7 to 69 years, National Institute for Public Health and the Environment 2011. Report number 350050006/2011.
Report Dairy Consumption in the Netherlands. Results of the Dutch National Food Consumption Survey 2007-2010. Report written by Dr Diewertje Sluik and Prof Dr Edith Feskens, July 2013 (this Report is in Dutch).
Norway:
National diet surveys of adults from 2010 (Norkost3).
Figures refer to percentage contribution of milk, yogurt, cheese, butter and cream products for population aged 18-70 years to nutrient intakes. Survey conducted by Department of Nutrition, University of Oslo, the Directorate of Health, and the Norwegian Food Safety Authority.
Risiko for jodmangel i Norge. Identifisering av et akutt behov for tiltak. Nasjonalt råd for ernæring, Helsedirektoratet, IS-0591 (this report is in Norwegian, June 2016).
UK:
National Diet and Nutrition Survey 2012/13 – 2013/14
Figures refer to percentage contribution of the ‘milk, yogurt & cheese’ food group for UK adults aged 19-64 years.
National Diet and Nutrition Survey. Results from Years 5 and 6 (combined) of the Rolling Programme (2012/13 – 2013/14). A survey carried out on behalf of Public Health England and the Food Standards Agency, 2016
References
1. European Commission. EU Register of nutrition and health claims made on foods EU Register on nutrition and health clams. http://ec.europa.eu/nuhclaims/ (accessed 11/10/13).
2. Vissers PA et al. Contribution of dairy products to micronutrient intake in The Netherlands. J Am Coll Nutr. 2011; 30(5 Suppl 1): 415S-421S.
3. Coudray B. Contribution of dairy products to micronutrient intake in France. J Am Coll Nutr. 2011; 30(5 Suppl 1): 410S-414S.
4. Fulgoni VL 3rd et al. Nutrients from dairy foods are difficult to replace in diets of Americans: food pattern modeling and an analyses of the National Health and Nutrition Examination Survey 2003-2006. Nutr Res. 2011; 31: 759-765.
5. Mensink GB et al. Mapping low intake of micronutrients across Europe. Br J Nutr. 2013; 110: 755–773.
6. Gregory J et al. The National Diet and Nutrition Survey: Young People aged 4 to 18 years, Volume 1: Report of the Diet and Nutrition Survey. London: TSO, 2000.
7. De Ridder K, Bel S, Brocatus L, Lebacq T, Moyersoen I, Ost C & Teppers E. De consumptie van voedings¬middelen en de inname van voedingsstoffen. In: Bel S, Tafforeau J (ed.). Voedselconsumptiepeiling 2014-2015. Rapport 4. WIV-ISP, Brussel, 2016
8. Irish Universities Nutrition Alliance. Report on the Contribution of Dairy Foods to the Nutritional Quality of the Irish Adult Diet Commissioned by the National Dairy Council through Funds Awarded from the Dairy Research Trust Co-operative Society Ltd, 2012. Analysis based on the National Adult Nutrition Survey (NANS).
9. Laird E et al. Dairy intakes in older Irish adults and effects on vitamin micronutrient status: data from the TUDA study. J Nutr Health Aging. 2016. doi:10.1007/s12603-016-0845-4
10. CCAF (French eating behaviours and consumption) Surveys 2013 and 2016, CREDOC
11. Nordic Council of Ministers. Nordic Nutrition Recommendations 2012 - Part 1. Summary, Principles and Use. 5th edition. Copenhagen, Denmark: Nordic Council of Ministers; 2013. http://www.norden.org/en/publications/publikationer/nord-2013-009 (accessed 20/10/2013).
12. Drewnowski A & Fulgoni V 3rd. Nutrient profiling of foods: creating a nutrient–rich food index. Nutr Rev. 2008; 66: 23-39.
13. Drewnowski A & Darmon N. The economics of obesity: dietary energy density and energy cost. Am J Clin Nutr. 2005; 82: 265S-273S.
14. Maillot M et al. Nutrient profiling can help identify foods of good nutritional quality for their price: a validation study with linear programming. J Nutr. 2008; 138: 1107-1113.
15. Drewnowski A et al. Low-energy-density diets are associated with higher diet quality and higher diet costs in French adults. J Am Diet Assoc. 2007; 107: 1028-1032.
16. Darmon N & Drewnowski A. The contribution of food prices and diet cost to socioeconomic disparities in diet quality: a systematic review and analysis. Nutr Rev. 2015; 7: 643-660.
17. Health Council of the Netherlands. Dutch dietary guidelines 2015. The Hague: Health Council of the Netherlands, 2015; publication no. 2015/24E.